Multi-Angle Deep Research Explained: The Modern Investor's Edge
By ClaritX Research Team ·
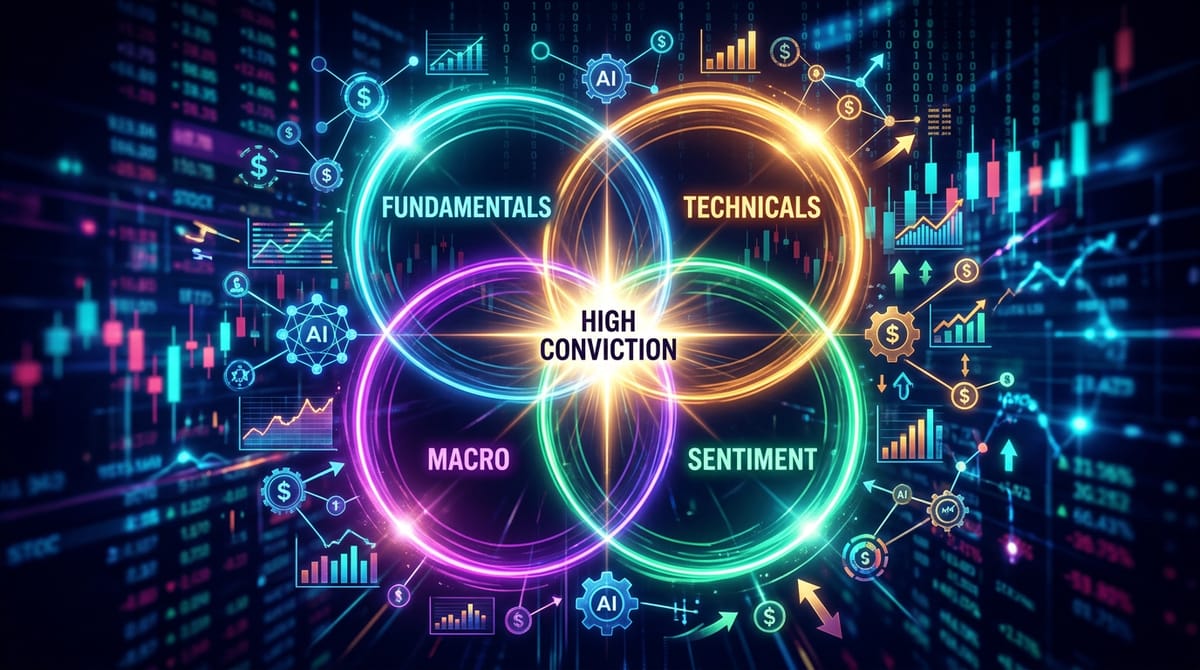
<h2>Introduction: The Pitfalls of Tunnel Vision in Modern Investing</h2> <p>Information overload is the modern investor's greatest challenge. In today's hyper-connected, high-frequency financial markets, relying on a single dimension of analysis—whether it is strictly reading balance sheets or exclusively drawing lines on a chart—often leads to poor timing, value traps, or devastating blind spots. Tunnel vision in investing creates a fragile portfolio. A fundamental value investor might buy an 'undervalued' stock, only to catch a falling knife because they ignored rapidly deteriorating market sentiment. Conversely, a technical momentum trader might ride a chart breakout, only to be crushed by a sudden, unforeseen macroeconomic interest rate hike.</p> <p>To gain a true informational edge, elite investors and algorithmic institutions are turning to a holistic methodology. <strong>Multi-Angle Deep Research</strong> is the practice of finding confluence—the precise intersection where fundamental reality, technical price action, macroeconomic tailwinds, and market sentiment seamlessly align. By evaluating assets from completely distinct viewpoints, investors can systematically filter out market noise, eliminate emotional biases, and identify 'high-conviction' trades that offer asymmetrical risk-reward profiles.</p>
<h2>What is Multi-Angle Deep Research? (Defining the Concept)</h2> <p>Multi-Angle Deep Research is a modern investment methodology that decomposes a core investment thesis into parallel investigative queries to evaluate an asset from multiple, diverse perspectives simultaneously. Conceptually, it represents the tech-enabled evolution of the classic 'Mosaic Theory.' Endorsed by the CFA Institute, the Mosaic Theory is a framework where analysts stitch together diverse pieces of public and non-material, non-public information to form a holistic picture of a company's true valuation.</p> <p>While the Mosaic Theory was historically manual and labor-intensive, modern Multi-Angle Deep Research is highly systematized. Today, multi-agent AI systems and sophisticated financial analysts perform this deep research to process heterogeneous data streams rapidly. By cross-validating insights across fundamentals, technicals, and alternative datasets, the approach ruthlessly exposes contradictions in market pricing and uncovers hidden risks that single-angle researchers routinely miss.</p>
<h2>The 4 Pillars of Comprehensive Financial Analysis</h2> <p>To build a robust investment thesis, one must understand that no asset exists in a vacuum. A comprehensive research framework rests on four distinct pillars, each serving a unique function in answering the critical questions of trading: <em>Why</em>, <em>When</em>, <em>Where</em>, and <em>Who</em>.</p>
<h2>Pillar 1: Fundamental Analysis (Understanding Intrinsic Value)</h2> <p>Fundamental analysis serves as the bedrock for long-term value investing. It is the pursuit of a security's intrinsic or 'fair' value by examining related economic, financial, and qualitative factors to determine if an asset is fundamentally overvalued or undervalued. This pillar answers the <strong>"Why"</strong> to trade.</p> <p>Key elements of fundamental analysis include deep forensic dives into financial statements: income statements, balance sheets, and cash flow reports. Analysts calculate and compare crucial financial ratios such as Price-to-Earnings (P/E), Return on Equity (ROE), and Debt-to-Equity to gauge profitability, efficiency, and leverage. Beyond the hard numbers, fundamental analysis also requires qualitative assessments, evaluating company management track records, brand strength, and the width of the business's competitive moat. By establishing the true financial health and long-term earnings potential of an asset, fundamental analysis ensures that the core of your investment is structurally sound, even if market turbulence occurs in the short term.</p>
<h2>Pillar 2: Technical Analysis (Timing the Market & Price Action)</h2> <p>While fundamental analysis tells you what to buy, technical analysis dictates <strong>"When"</strong> to execute the trade. Moving beyond intrinsic business value, technical analysis evaluates market mechanics and statistical risk factors. It is the study of historical market data, primarily price and volume, to identify patterns and forecast future price movements based on the premise that asset charts reflect all known information and tell a predictable behavioral story.</p> <p>The key elements of this pillar involve tracking historical price changes, analyzing candlestick patterns, and monitoring trading volumes to gauge the strength of a move. Technical analysts utilize trend indicators such as moving averages, Bollinger bands, and Fibonacci retracements to map out support and resistance zones. Incorporating this angle ensures that investors optimize their short-term trades by identifying the most strategic entry and exit points, validating market momentum before committing capital.</p>
<h2>Pillar 3: Macroeconomic Context (Interest Rates, Inflation, and Global Trends)</h2> <p>Even the strongest company with the most beautiful chart pattern can be dismantled by broader systemic forces. The macroeconomic angle assesses the broad economic, political, and systemic environments that influence asset prices across entire sectors, markets, or countries. This provides the crucial top-down context necessary to understand systemic risks.</p> <p>In this pillar, analysts track economic indicators like GDP growth, inflation (such as the Consumer Price Index), and unemployment rates. Monetary policy plays a massive role here; changes in interest rates by central banks and shifting yield curves can instantly reprice the valuation of equities, especially growth stocks. Furthermore, macroeconomic analysis demands an awareness of geopolitical risks, international trade vulnerabilities, and supply chain disruptions. Understanding this angle prevents investors from fighting massive, unstoppable structural market shifts.</p>
<h2>Pillar 4: Sentiment & Alternative Data (Crowd Psychology, Options Flow, ESG)</h2> <p>Often referred to as the 'Scuttlebutt' or Mosaic angle, Sentiment and Alternative Data Analysis is the extraction of actionable insights from non-traditional, real-time datasets. This pillar answers the <strong>"Who is trading"</strong> question and acts as a critical driver of 'alpha' (excess returns) in modern research.</p> <p>This angle gauges market psychology, fear, greed, and institutional positioning. Analysts look at real-time social media feeds, financial news sentiment, and options flow (such as Delta 40-60 institutional trades, which indicate pure directional conviction rather than basic hedging). Moreover, alternative data includes satellite imagery for tracking shipping and industrial activity, workforce insights via platforms like Glassdoor, ESG scores, and app download intelligence. Accelerated by AI, the alternative data market is expanding rapidly—projected to reach $854.34 billion by 2035—with 94% of investment managers expected to actively use AI in their alternative data processes by 2026. This pillar brings richer, timelier insights into decision-making, allowing investors to detect early risks before they are ever published in an official quarterly earnings report.</p>
<h2>Real-World Case Study: When the Angles Align</h2> <p>History provides powerful examples of how single-angle tunnel vision leads to catastrophe, while multi-angle deep research yields massive asymmetric returns.</p> <p><strong>The 2007-2008 Subprime Mortgage Crisis:</strong> Wall Street institutions and credit rating agencies relied heavily on surface-level historical price trends and broad credit ratings. This single-angle approach assumed housing prices would continuously rise, completely ignoring underlying loan quality. In contrast, Dr. Michael Burry employed a multi-angle strategy. He combined forensic fundamental analysis of mortgage bond prospectuses (noting extreme loan-to-value ratios and no-documentation subprime loans) with macroeconomic tracking of adjustable-rate mortgage reset dates. Synthesizing these diverse data points allowed him to predict the housing collapse and profit massively, while single-angle investors suffered historic losses.</p> <p><strong>The Collapse of Wirecard AG (2020):</strong> Traditional investors, top-tier auditors, and regulators relied entirely on audited financial statements, steady revenue growth, and stock momentum. Regulators even banned short-selling to protect the company. However, investigative journalists and short-sellers utilized a multi-angle approach incorporating forensic accounting, alternative data, and on-the-ground investigative work. They physically visited purported Asian office locations, analyzed third-party acquiring partners, and interviewed whistleblowers. This multi-angle research exposed a 1.9 billion euro gap, proving the official financial filings entirely fraudulent.</p> <p><strong>The GameStop (GME) Short Squeeze (2021):</strong> Institutional hedge funds relied strictly on traditional fundamental analysis, shorting GME heavily because it was a struggling brick-and-mortar retailer. Meanwhile, retail investors combined fundamentals with market microstructure and social sentiment. They identified that short interest exceeded 130% of the available float. By synthesizing this structural vulnerability with real-time alternative data (explosive social media momentum and options chain activity), they recognized the perfect conditions for a massive squeeze. Multi-angle analysis correctly predicted an explosive market movement, costing single-angle hedge funds billions.</p>
<h2>How to Build Your Own Multi-Angle Research Framework</h2> <p>Implementing this strategy requires discipline and a systematic approach. Here is a step-by-step framework to build your own multi-angle engine:</p> <ul> <li><strong>Step 1: Thesis Decomposition.</strong> Start with your core investment question and break it down into parallel sub-queries addressing the four research angles. Set strict source and evidence requirements for each pillar to avoid confirmation bias.</li> <li><strong>Step 2: Data Acquisition & Mosaic Building.</strong> Gather heterogeneous data for each angle using traditional SEC filings, factor models, and alternative data tools. Ensure strict compliance with securities laws by exclusively utilizing public or non-material non-public information.</li> <li><strong>Step 3: Multi-Angle Validation.</strong> Look for confluence across the different perspectives. The highest conviction investments occur when an asset is fundamentally undervalued, forming a bullish technical pattern, and supported by positive macroeconomic tailwinds and alternative data.</li> <li><strong>Step 4: Risk & Tension Synthesis.</strong> Identify contradictions. If fundamentals appear strong but alternative data (like employee turnover or app search trends) is rapidly deteriorating, this tension highlights a critical hidden risk that the consensus is missing.</li> <li><strong>Step 5: Execution & Dynamic Monitoring.</strong> Construct the portfolio using a multi-factor approach to balance exposures. Utilize automated tools or AI research agents to continuously monitor for thesis-changing developments across any individual angle.</li> </ul>
<h2>Essential Tools and Platforms for Retail Investors</h2> <p>Executing Multi-Angle Deep Research previously required a $25,000 Bloomberg Terminal. Today, an ecosystem of specialized, accessible platforms democratizes this power for retail investors:</p> <ul> <li><strong>Koyfin:</strong> A robust, Bloomberg-style research terminal providing institutional-quality data. Tracking over 100,000 global securities alongside macro datasets, Koyfin features an advanced screener with over 5,900 filter criteria and 10+ years of historical financials. It is considered the best overall data terminal for fundamental and macro confluence.</li> <li><strong>Fiscal.ai (formerly FinChat):</strong> An AI-native fundamental research platform integrating conversational AI with deep financial metrics. It tracks over 2,250 company-specific KPIs (like SaaS subscriber growth) and includes built-in Discounted Cash Flow (DCF) modeling, offering a glimpse into the AI-powered future of retail research.</li> <li><strong>TIKR:</strong> A streamlined global equity screener focused on deep historical financials. Covering over 100,000 stocks across 92 countries with up to 20 years of data, it is highly cost-effective and excellent for value investors prioritizing international stock coverage.</li> <li><strong>TradingView:</strong> The undisputed global leader for Technical Analysis & Charting. It provides interactive, high-speed charting across all asset classes, supports extensive technical indicators, custom scripting via Pine Script, and fosters a vibrant social community for sharing technical setups.</li> <li><strong>Seeking Alpha:</strong> A platform blending qualitative human analysis with algorithmic stock scoring. It features proprietary 'Quant Ratings' evaluating stocks on a 1 to 5 scale, hosts over 1 million crowdsourced articles, and integrates AI-generated 'Virtual Analyst Reports' to algorithmically validate ideas.</li> <li><strong>TipRanks:</strong> Perfect for tracking market sentiment and the 'smart money'. TipRanks evaluates the historical accuracy of Wall Street analysts, financial bloggers, and corporate insiders. It aggregates institutional price targets and tracks insider trading activities, bringing immense transparency to the market.</li> <li><strong>Prospero.ai:</strong> A mobile-first AI application that curates daily stock picks by running an AI engine across trend signals, technical indicators, and real-time market data. It simplifies complex institutional analytics into actionable, conviction-driven retail insights.</li> <li><strong>AltIndex:</strong> An alternative data platform providing non-traditional datasets like social media sentiment, web traffic, app downloads, and hiring trends across 2,500+ stocks. It is highly effective for spotting shifting consumer demand before it hits quarterly earnings.</li> </ul>
<h2>Conclusion: Synthesizing Data into High-Conviction Decisions</h2> <p>At the heart of Multi-Angle Deep Research is the pursuit of confluence. By visualizing the market through a Three-Circle Overlapping Venn Diagram, traders can systematically categorize their trading setups and avoid devastating pitfalls.</p> <p>If you trade based solely on <em>Fundamental + Technical Analysis</em> without considering sentiment, you expose yourself to <strong>"The Crowded Trade Risk."</strong> You might buy a strong business in a technical uptrend right at the peak of market euphoria, vulnerable to a sudden macro shock because all the good news is already priced in.</p> <p>If you rely on <em>Technical + Sentiment Analysis</em> without fundamentals, you are engaging in <strong>"Momentum Speculation."</strong> Trading pure price action and market hype without underlying business strength can be profitable short-term but is highly prone to aggressive, unpredictable, and devastating reversals.</p> <p>If you blend <em>Fundamental + Sentiment Analysis</em> without technical confirmation, you risk catching <strong>"The Falling Knife."</strong> Identifying an undervalued asset amidst extreme market pessimism is great, but without a technical base pattern or moving average crossover validating a trend change, you can suffer severe drawdowns as the asset continues to plummet.</p> <p>The ultimate goal is the <strong>Center Confluence</strong>—the High-Conviction Trade. This occurs when you find a fundamentally sound asset, triggering a technical breakout or reversal, supported by shifting or extreme sentiment and macroeconomic tailwinds. This multi-angle validation provides the unparalleled confidence needed to appropriately size positions, effectively manage risk, and thrive in an increasingly complex financial landscape.</p>
How this content was created
This article was created by the ClaritX Research Engine — an AI system that analyzes and cross-checks information from reliable, named sources. Published . Found an error? Report it — see our editorial policy and corrections process. Educational content only — not investment advice (full disclaimer).